Or how much can you lose
I do not believe that spreadsheets can change the world but let’s give it a try.
The world is becoming more and more interconnected and complex. The uncertainty about global events causing unexpected changes is unprecedented. Doing business in our times is riskier than ever before.
The aim of this article is to present a simple yet powerful technique for identifying bottlenecks in business finances. Through simple simulations, you will be able to monitor how different variables affects your business bottom line.
The example below is suitable for trade and production businesses but it can be easily adjusted for other sectors like services, finance and etc.
Pre-requirements
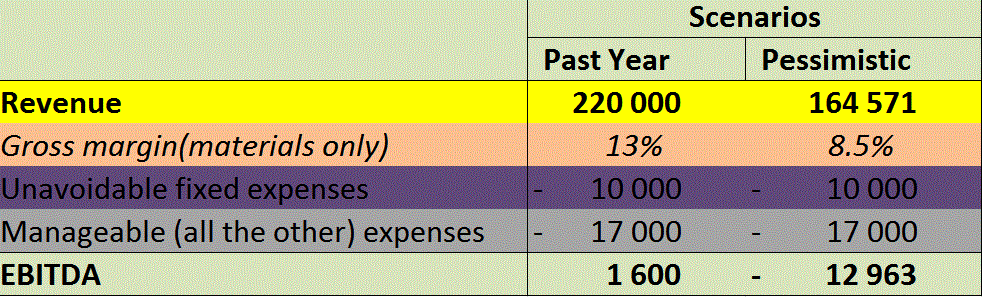
Green. Doing sustainable business requires to make a profit. This is the financial surplus you gained from trading and producing. We will be using EBITDA (Earnings before interest, tax, and depreciation) as a more general and simplified representation of profit and loss.
So our goal is to simulate what could happen to EBITDA when other variables change.
Orange. In most businesses, the most significant operational cost is the materials and goods used for sale or production. These costs can easily take from 50% to 90% of all the business expenses. We measure these costs by using the gross margin which is calculated like = (sales – material expenses)/sales
If we do not change our sales prices to keep a constant (or increasing) gross margin than our EBITDA will be affected in a significantly negative way. We shall see that later on.
To manage all other business expenses in a simple way we should classify them in the following categories:
Purple. Unavoidable fixed expenses. These expenses we simply cannot manage. We have to pay them in order for our business to operate. We cannot postpone them, nor negotiate them nor decrease them.
Grey. All the other expenses that are not expense on material nor unavoidable expenses. These expenses you can in some way decrease without killing your business.
Example:
- Calculate your expected revenue and pessimistic revenue
- Calculate your average historical gross margin and a pessimistic one
- Calculate your unavoidable expenses
- Calculate your manageable expenses
- Calculate EBITDA
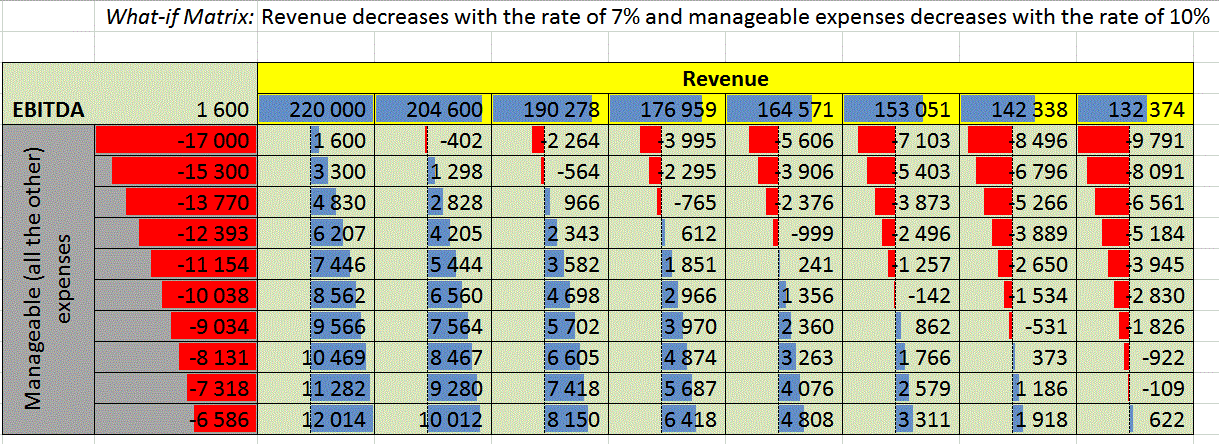
- Simulate different EBITDA’s while you decreasing revenues and manageable expenses
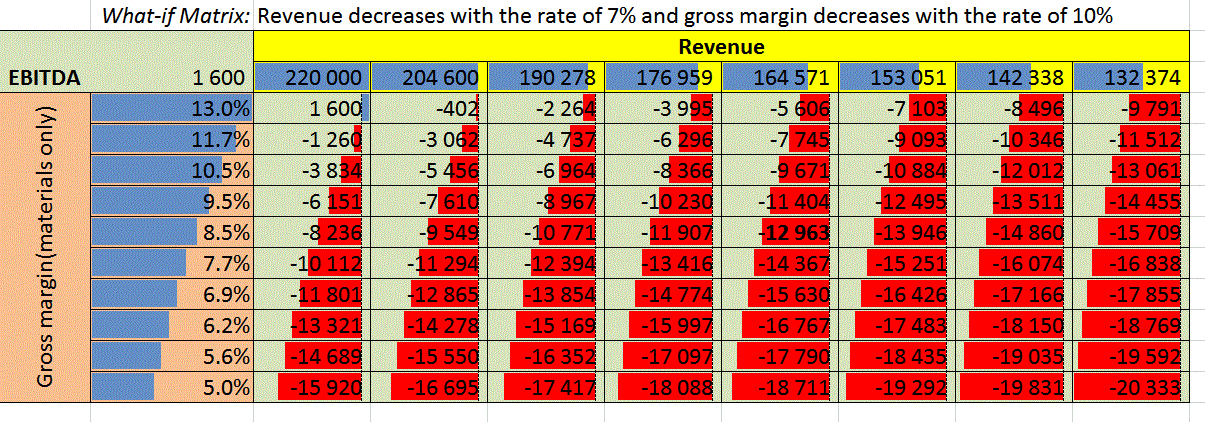
- Simulate different EBITDA’s while you decreasing revenues and gross margins
- Examine how sensate your business is to decrease in revenues and a decrease in manageable expenses
- Examine how sensate your business is to decrease in revenues and a decrease in gross margin
*For step 6 and 7 use MS Excel/Data/What-if-Analysis/Data Table